What Your WiFi Card Throws Away, and What It Could Have Told You
Every WiFi access point in your building is quietly broadcasting a signal that bounces off walls, desks, and the people walking between them. Your laptop already listens to all of it, dozens of times a second, and then throws almost everything away except "am I still connected?"
- Python
- WiFi Sensing
- Signal Processing
- matplotlib
- NumPy
- Windows WLAN API
- Problem
- Commodity laptops discard nearly everything their WiFi radio hears, so mapping who and what occupies a space normally needs special hardware.
- Outcome
- A stock laptop maps devices, motion direction and walls, finding 3 of 3 doors in simulation.
Can a Laptop See a Room Through WiFi? Notes From a Weekend Experiment
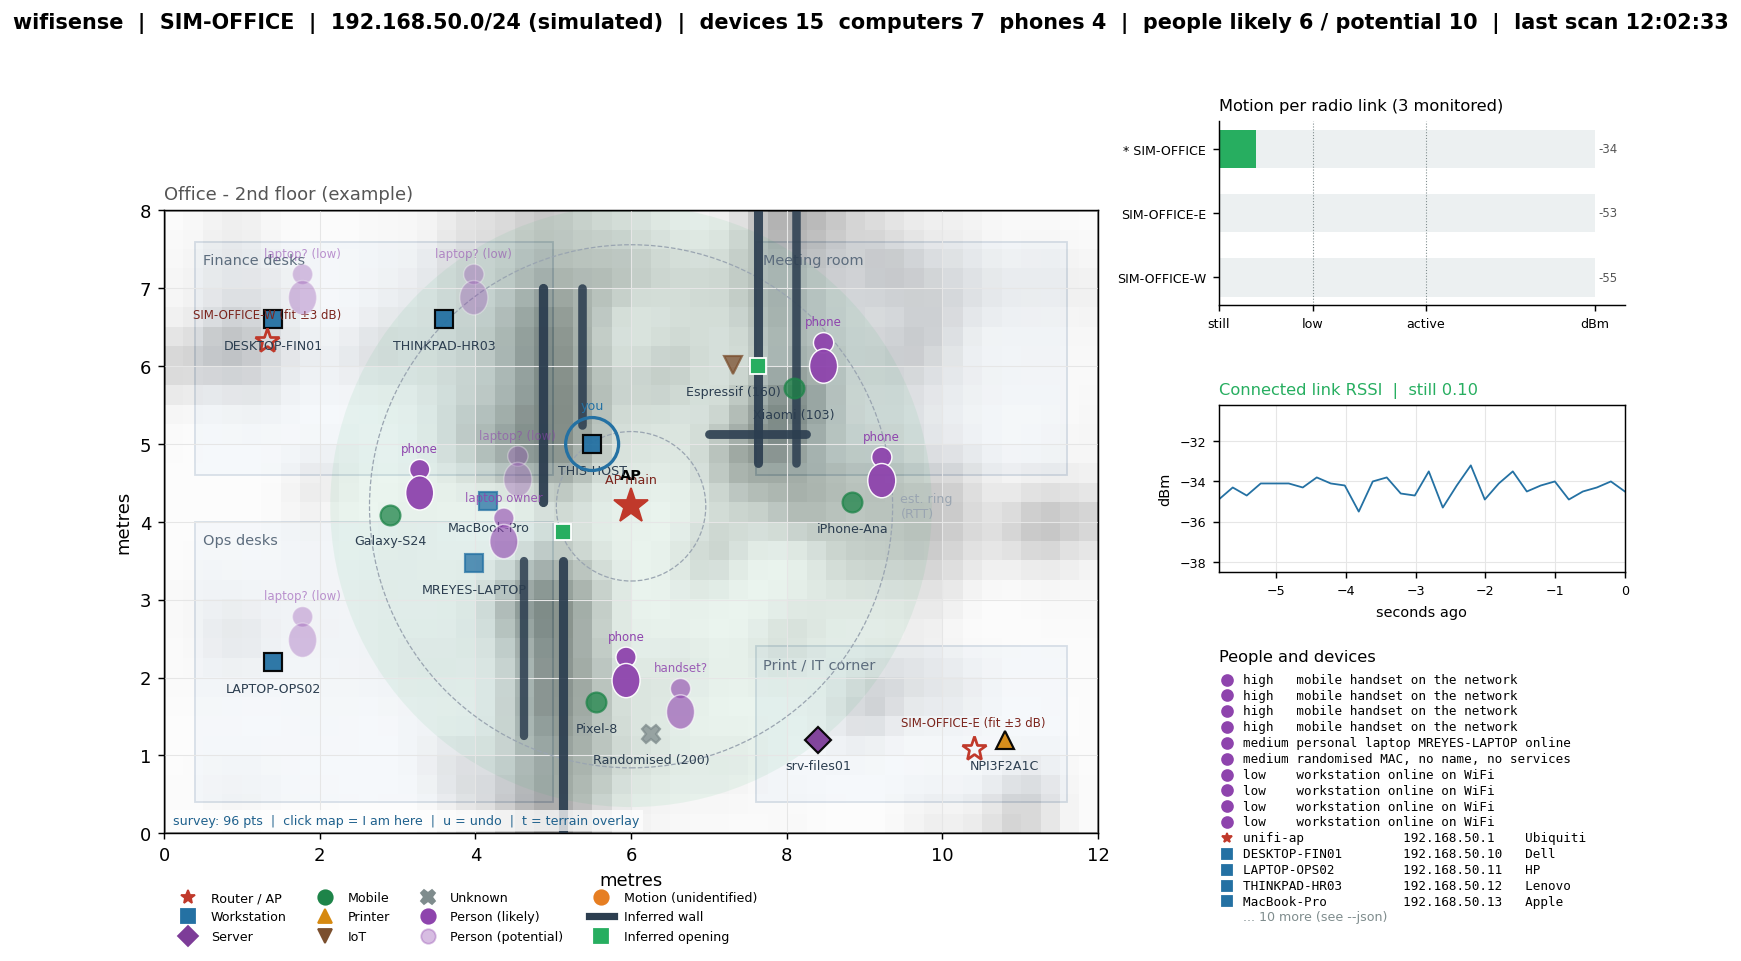
Simulated office: people by confidence, inferred walls and doors, motion per radio link
Every WiFi access point in your building is quietly broadcasting a signal that bounces off walls, desks, and the people walking between them. Your laptop already listens to all of it, dozens of times a second, and then throws almost everything away except "am I still connected?"
I wanted to know how much of that discarded information a plain Windows laptop could turn back into a picture. No special radios, no drivers, no admin rights. Just Python, the network card that came with the machine, and a question: can it tell me who is in the room, where the computers are, and roughly where the walls stand?
The short answer is partly, and more than I expected. Here is what I built, what worked, what did not, and why I think it is a good project for anyone who likes signals, maps, or slightly unreasonable ideas.
The honest starting point
Academic WiFi sensing is genuinely astonishing. Research systems read Channel State Information (CSI), the fine-grained per-subcarrier response of the channel, and use it to detect breathing, recognise gestures, even track people through walls. They also need specific hardware: an old Intel 5300 card, an ESP32 with custom firmware, or a Raspberry Pi with a patched driver.
A consumer laptop on Windows exposes none of that. What it does expose, through the native WLAN API, is the received signal strength of every access point in range, in real dBm, refreshed on demand. From my desk at home that is nineteen radios. Each one is a separate path through the house. That is not CSI, but nineteen noisy sensors pointing in nineteen directions is not nothing.
So the rules of the experiment became: use only what the OS gives away for free, be explicit about confidence everywhere, and see how far that goes.
Four layers, one map
Layer 1: what is on the network. A ping sweep and the ARP table find every live host on the subnet. Reverse DNS, a handful of TCP port probes, and a vendor lookup on the MAC address classify each one as a workstation, server, phone, printer, or IoT device. Windows machines announce themselves through RDP and SMB ports; iPhones through a sync port; corporate laptops through asset-tag hostnames. This layer is old-school network reconnaissance, and it is the most reliable thing in the project.
Layer 2: is anything moving? When a person walks between your laptop and an access point, the multipath pattern shifts and the signal strength wobbles. A still room has a tight noise floor; motion widens it. Tracking the rolling standard deviation of RSSI against an adaptive baseline gives a motion score from zero to one. Crude, but it lights up when someone walks past.
Layer 3: moving where? This was the fun part. Running that same motion detector on every radio in range turns the laptop into a small sensor array. If the links to the access points on your left get noisy and the ones on your right stay calm, the disturbance is on your left. The app places an orange "unidentified motion" marker at the weighted midpoint of the perturbed links. In simulation it lands within a metre of the walker. It is a direction, not a position, and I say so on the map.
Layer 4: the walls. You cannot sense terrain from a chair. But if you walk the room with the laptop and click your position on the map every metre or so, each click records what every radio measured from that spot. Fit each radio to a path-loss model, and the difference between the model and the measurement is excess loss: the extra attenuation from whatever stands between you and that access point. A wall shows up as a step of several dB in that field.
The insight that made this work took me an afternoon to find. Doorways cast shadow edges that fan outward from each access point, and my first version drew those as walls everywhere. But a real wall adds loss as you move away from the access point across it, while a shadow edge changes the field sideways. Taking only the outward radial component of the gradient made the false walls disappear. Straight runs of high-gradient cells become wall segments; short gaps between them become doors.
What actually came out
On a simulated 12 by 8 metre office with three access points and 96 survey points, the algorithm placed the two unknown access points within a metre, drew wall segments of which eight in ten lay on real walls, and found all three doors within 0.7 metres of where I had put them. That is with 0.8 dB of simulated noise.
Real hardware is noisier, two to three dB per reading, so every survey click now averages two forced scans and I expect real walls to come out coarser and thin partitions to vanish entirely. The device map, the motion detection, and the multi-radio direction all work on the real network. The terrain layer is the one still waiting for a proper walk-around of a room whose walls I know.
The people layer is deliberately labelled as potential people. A phone on the network is strong evidence. A randomised MAC with no name and no services is probably a sleeping handset. A laptop named after its owner suggests the owner is nearby. Anything else is a low-confidence guess, drawn faded. Nobody without a device is visible except through motion, and the map never pretends otherwise.
What I learned
Confidence is the product. Every marker on the map carries its evidence. The moment I hid that, the map became a lie.
Geometry beats filtering. The radial-gradient trick removed more noise than any smoothing parameter I tuned.
More radios, better everything. Neighbours' access points are free sensors. An apartment building is a better lab than a detached house.
This is personal data. MAC addresses, hostnames, a map of who sits where. I gitignored every output file and I would not run the scanning part on a network I did not administer without permission in writing.
Why you might want to pick this up
The code is about two thousand lines of Python with matplotlib as the only dependency, split into small modules: discovery, presence, links, people, survey, terrain, rendering. It runs in simulation with no network at all, which is where I would start. From there, some directions that I think are worth a weekend each:
Add a CSI node. An ESP32 with CSI firmware costs a few dollars and would replace the RSSI variance layer with something that can detect breathing.
Use two or three laptops as fixed stations and triangulate motion properly instead of taking link midpoints.
Replace the heuristics with a classifier trained on your own device population.
Turn the survey into a phone app: the laptop stays put, the phone reports where you are, and the walk-around becomes a five-minute job.
Do a proper accuracy study in a building with a known floor plan and publish the numbers. I would read it.
The repository has a --simulate --simulate-survey mode that shows the whole pipeline end to end in one command, a floor-plan format for pinning what you already know, and a test suite that checks terrain recovery against the simulated ground truth.
It is an experiment. It does not see through walls. But it sees a surprising amount through a network card that was only ever asked whether it was connected, and I think the interesting part is how much further it could go in someone else's hands.
Code and details: the WifiSensing repository on my GitHub. Run it only on networks you own or are authorised to test.